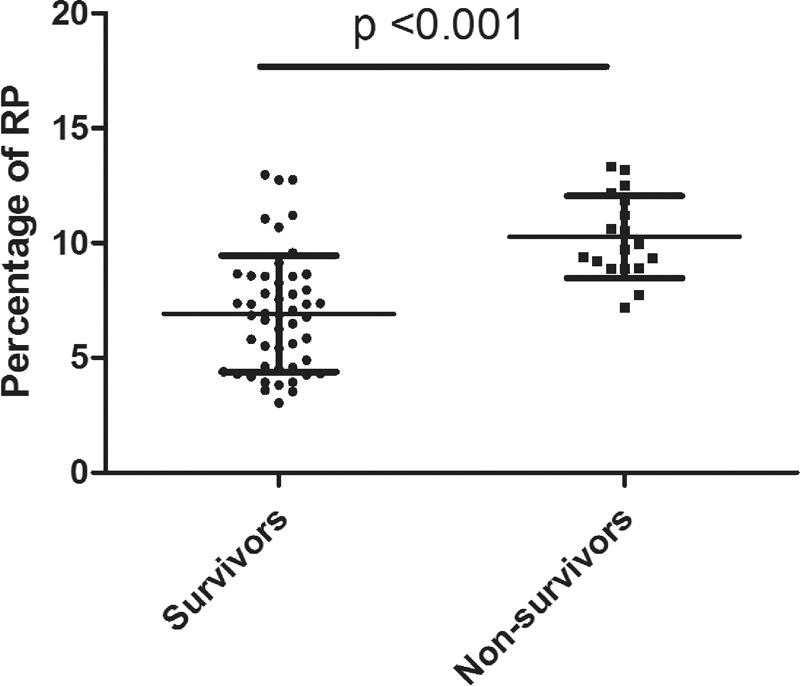
FIGURE 2.

RP% in surviving and non-surviving patients. A significant difference was observed between the groups. Box plot with median and 95% CI. CI = confidence interval, RP% = percentage of reticulated platelets.

RP% in surviving and non-surviving patients. A significant difference was observed between the groups. Box plot with median and 95% CI. CI = confidence interval, RP% = percentage of reticulated platelets.