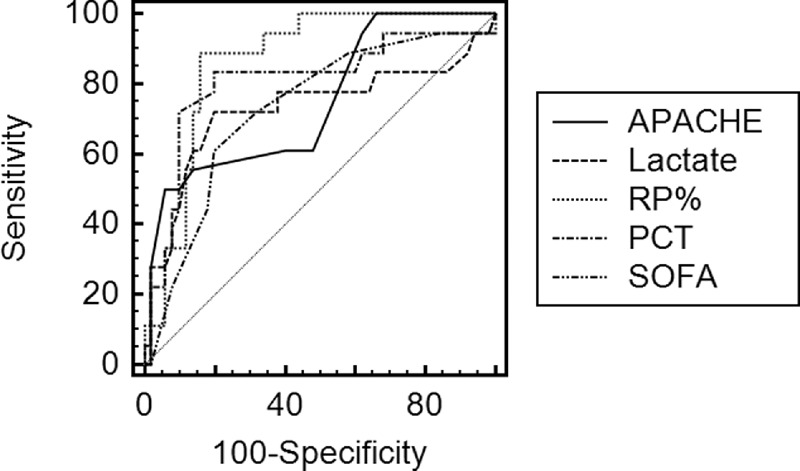
FIGURE 3.

ROC curves of the RP%, the APACHE II score, the SOFA score, the PCT, and the initial lactate level for predicting mortality after septic shock. The areas under the ROC curves for the RP%, the APACHE II score, the SOFA score, the PCT, and the initial lactate level were, respectively, 0.867 (95% CI 0.780–0.953, P < 0.001), 0.745 (95% CI 0.610–0.880, P = 0.002), 0.729 (95% CI 0.591–0.868, P = 0.004), 0.806 (95% CI 0.670–0.941, P < 0.001), and 0.730 (95% CI 0.567–0.893, P = 0.004). CI = confidence interval, PCT = procalcitonine, ROC = receiver-operating characteristic curve, RP% = percentage of reticulated platelet, SOFA = Sepsis-related Organ Failure Assessment.
