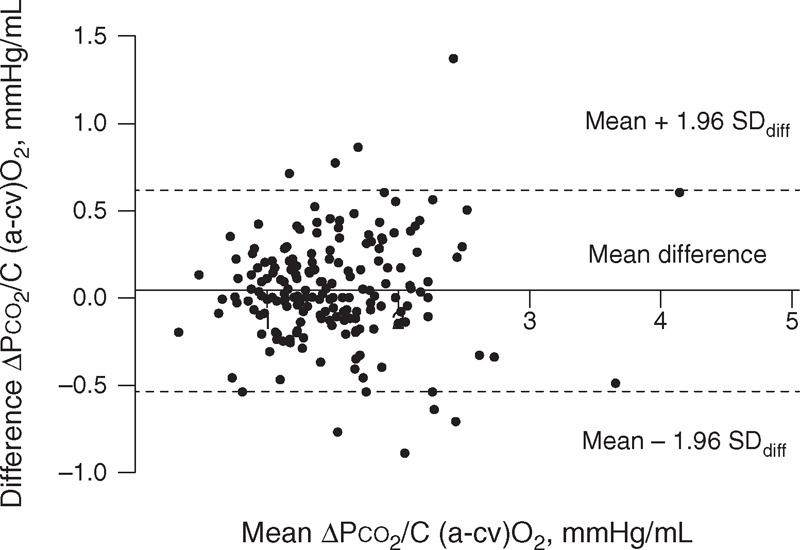
FIGURE 3.

Bland–Altman plot of the difference against the mean of the 2 ▵Pco2 over the central arteriovenous oxygen content difference (▵Pco2/C(a-cv)O2) ratio. ▵Pco2 = central venous-to-arterial carbon dioxide tension differences, ▵Pco2/C(a-cv)O2 = ratio of ▵Pco2 over the central arteriovenous oxygen content difference.
