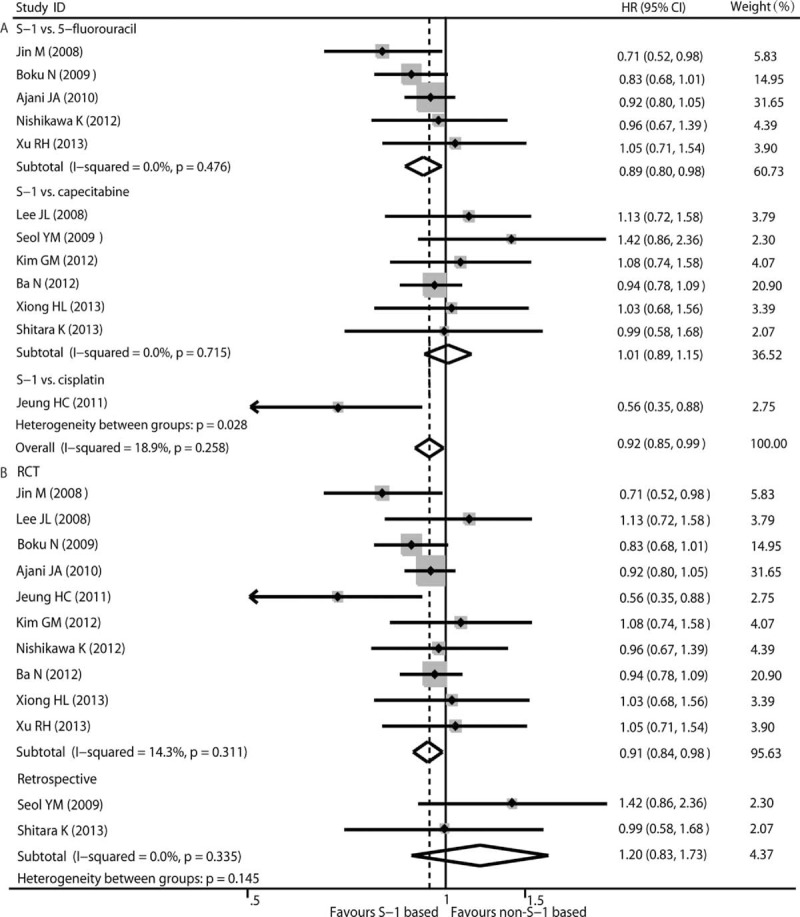
FIGURE 2.

Pooled analyses and subgroup analysis (A, B) of OS associated with S-1-based therapy compared with non-S-1 therapy. HR with its 95% CI <1 indicate a longer OS for S-1 based chemotherapy. HR = hazard ratio, OS = overall survival, RCT = randomized controlled trials.
