
FIGURE 3.
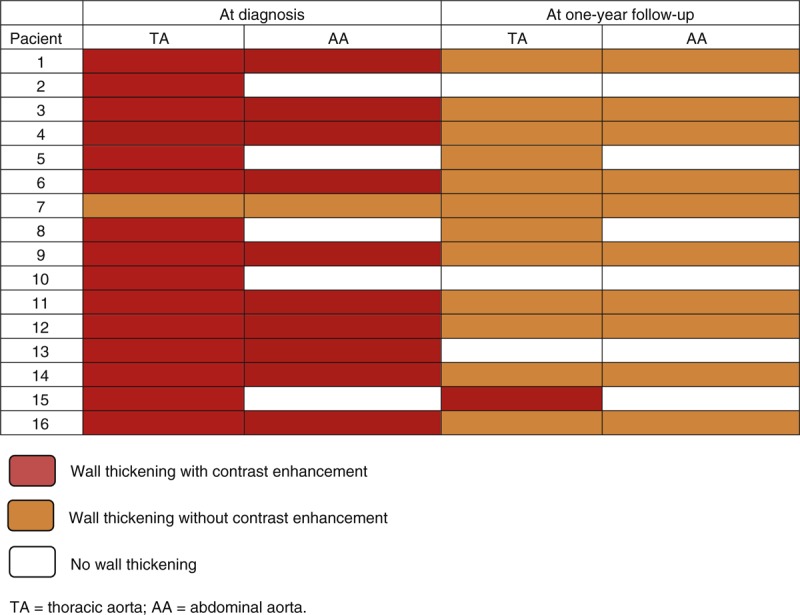
Distribution of the contrast enhancement in the followed GCA cohort at both radiologic assessments. TA = thoracic aorta; AA = abdominal aorta.
Official websites use .gov
A
.gov website belongs to an official
government organization in the United States.
Secure .gov websites use HTTPS
A lock (
) or https:// means you've safely
connected to the .gov website. Share sensitive
information only on official, secure websites.
Distribution of the contrast enhancement in the followed GCA cohort at both radiologic assessments. TA = thoracic aorta; AA = abdominal aorta.