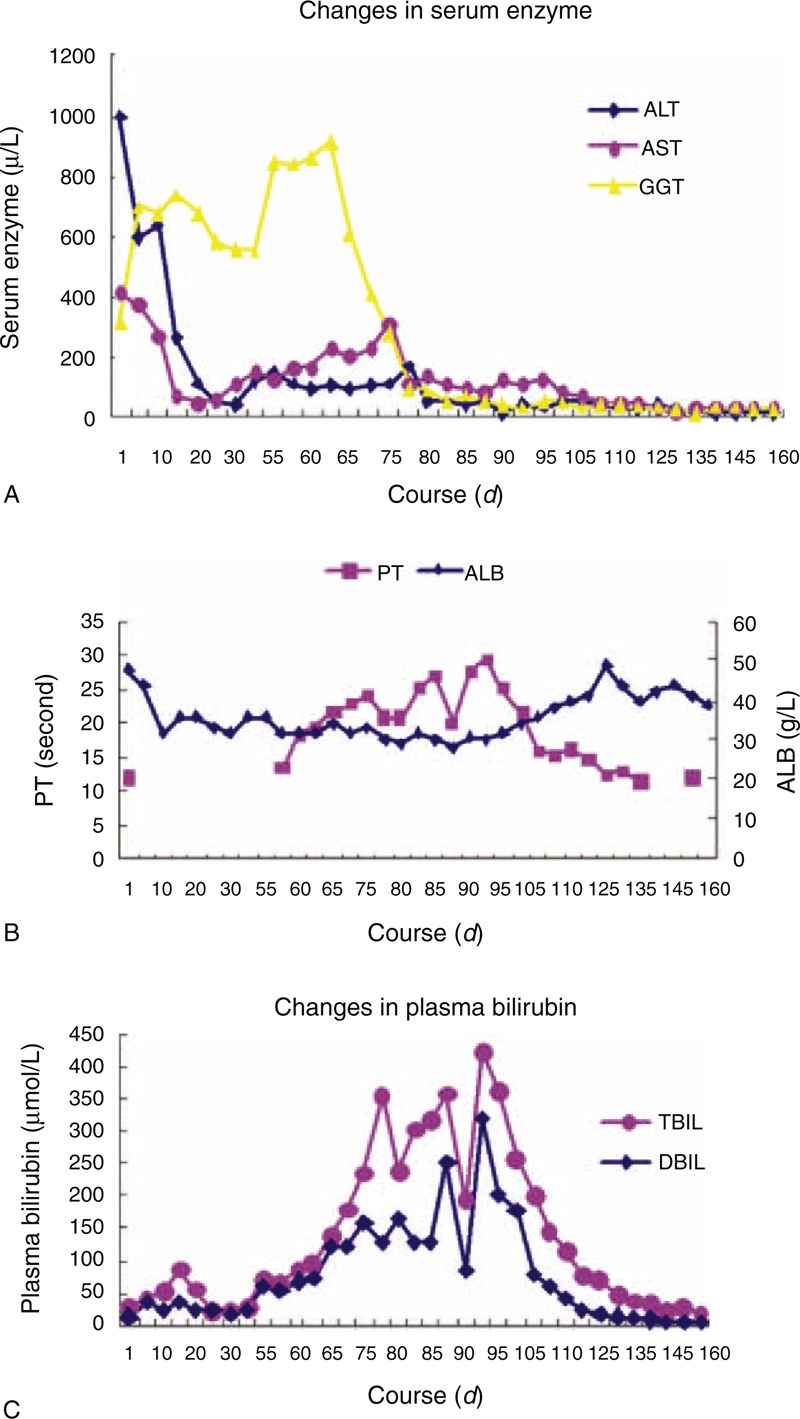
FIGURE 2.

Changes in serum enzyme. The ALT and AST (reflects the hepatocyte injury) were high at first and decreased after treatment, while GGT (reflects cholestasis) were not high but gradually increased within 2 months. It is in accordance with the characteristics of FCH. Changes in prothrombin and plasma albumin. These two indicators reflect the liver synthetic function, their alterations were similar to those in figure C, which show the liver metabolic function. Changes in plasma bilirubin. From day 42 to 98, the patients showed severe cholestasis and the BIL curve ascended sharply. There were several drop-downs on the peak due to plasmapheresis. The curve descended remarkably after the liver function began to benefit from the treatment.
