FIGURE 1.

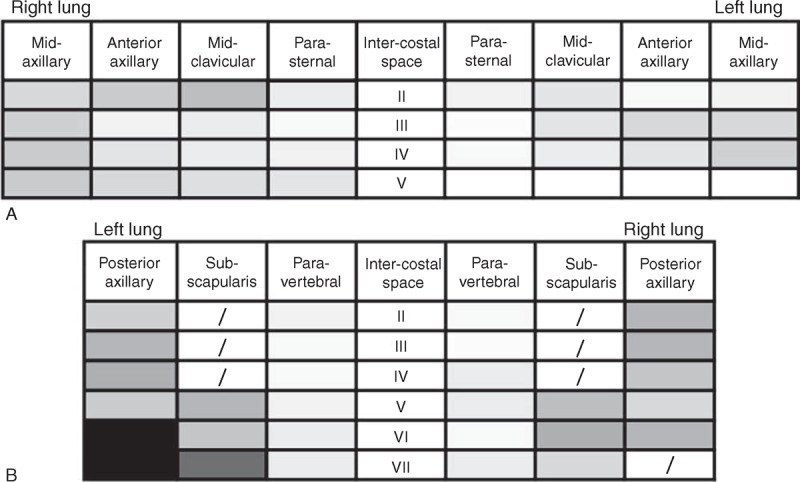
(A and B) Lung ultrasound scanning schemes with gray levels corresponding to mean number of B-lines pre-dialysis: antero-lateral (A) and posterior (B) scanning sites. Darker colors correspond to higher mean B-lines number.

(A and B) Lung ultrasound scanning schemes with gray levels corresponding to mean number of B-lines pre-dialysis: antero-lateral (A) and posterior (B) scanning sites. Darker colors correspond to higher mean B-lines number.