FIGURE 2.

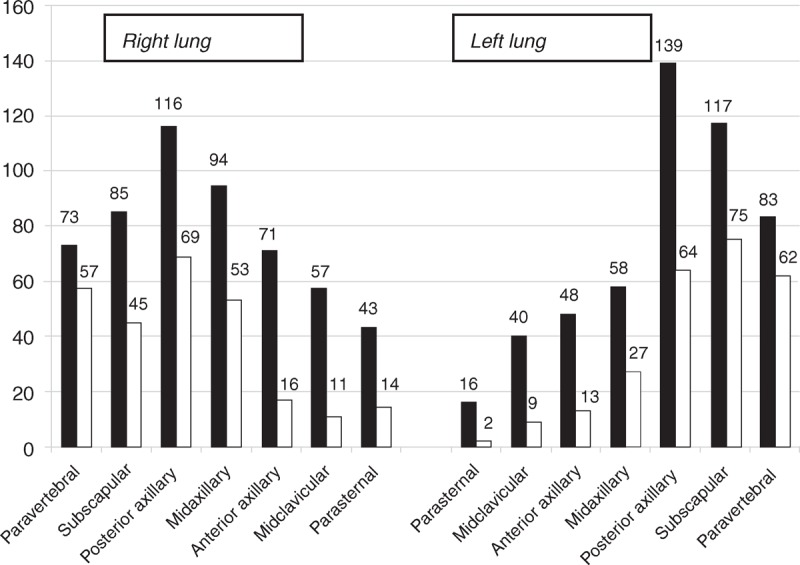
Lung ultrasound: frequency distribution of the B-lines along the different thoracic lines before (solid bars) and after (empty bars) the hemodialysis session.

Lung ultrasound: frequency distribution of the B-lines along the different thoracic lines before (solid bars) and after (empty bars) the hemodialysis session.