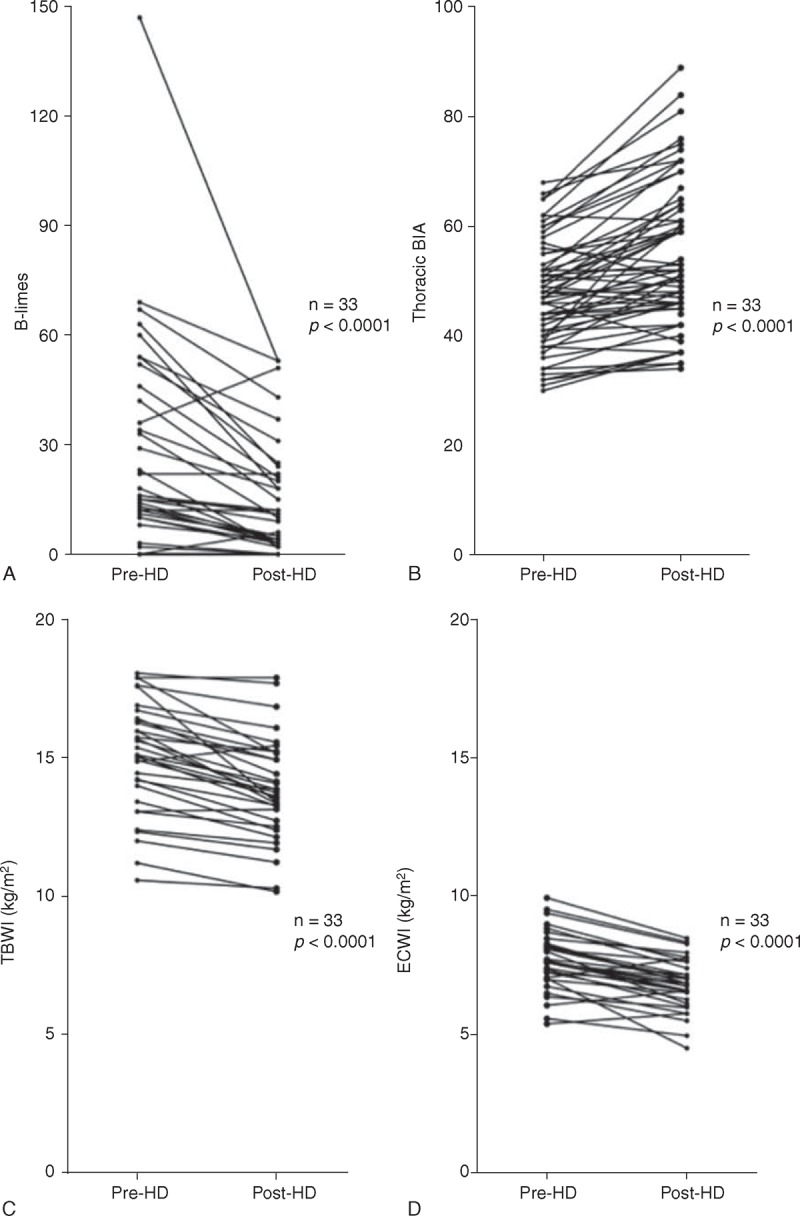
FIGURE 3.

(a–d) Dynamic variation after hemodialysis in the number of B-lines, evaluated by lung ultrasound and for comparison, in thoracic impedance, in total body water index (TBWI), and in extra-cellular water index (ECWI). Mean values ± SD are represented.
