
FIGURE 5.
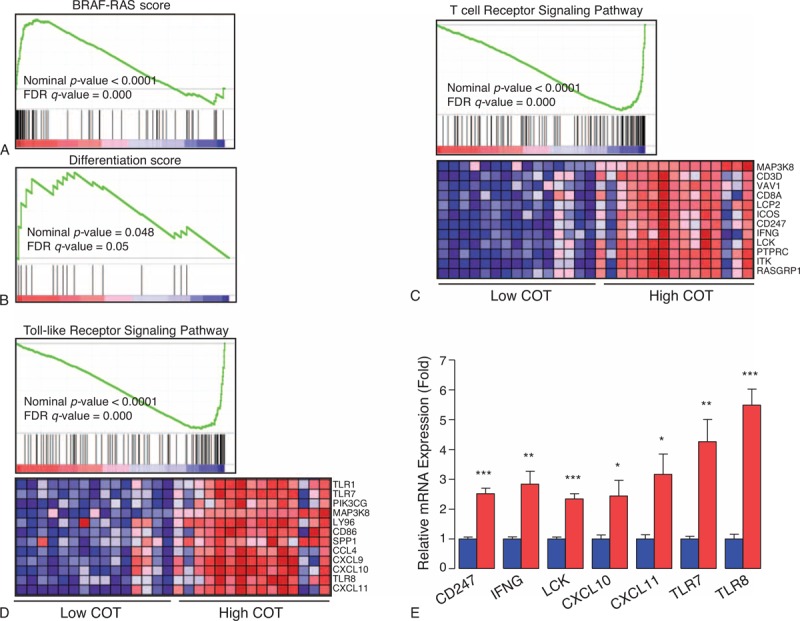
Relationship between expression levels of COT and gene sets. (A) B-RAF-RAS score, (B) thyroid differentiation score, (C) T-cell receptor signaling pathway, (D) Toll-like receptor signaling pathway. Gene set enrichment analysis using gene-expression profiles selected from NCBI GEO Record GSE33630. See detailed description in Methods and Results sections. (E) Quantitative PCR analysis of representative mRNA expression in highest COT expression PTCs (red box, n = 7) and lowest COT expression PTCs (blue box, n = 7) from our study subjects. Means were compared and analyzed by Mann–Whitney U test. All data are means ± standard error mean. ∗P < 0.05, ∗∗P < 0.01, ∗∗∗P < 0.001. All P values are 2-sided. All experiments were repeated 3 times, and each experiment was performed in triplicate. COT = Cancer Osaka Thyroid Oncogene mitogen-activated protein kinase kinase kinase 8, IHC = immunohistochemical staining, PTC = papillary thyroid cancer.