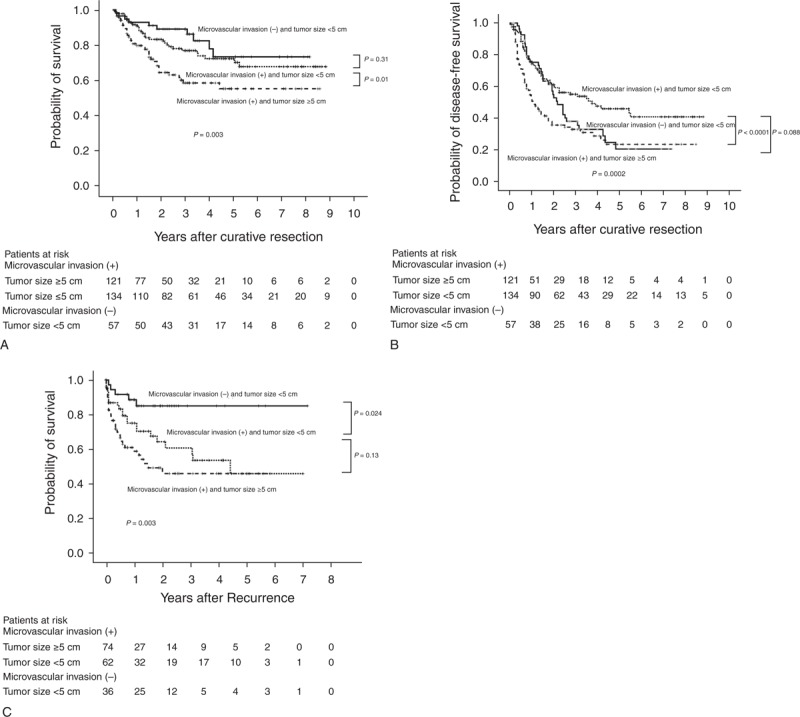
FIGURE 4.

(A) Comparison of the Kaplan–Meier curves for overall survival in patients who underwent primary curative resection for T2 HCC. (B) Comparison of the Kaplan–Meier curves for disease-free survival in patients who underwent primary curative resection for T2 HCC. (C) Comparison of the Kaplan–Meier curves for postrecurrence survival in patients who underwent primary curative resection for T2 HCC. HCC = hepatocellular carcinoma, MVI = microvascular invasion, T2 = solitary tumor with MVI or multiple tumors, none >5 cm.
