
FIGURE 3.
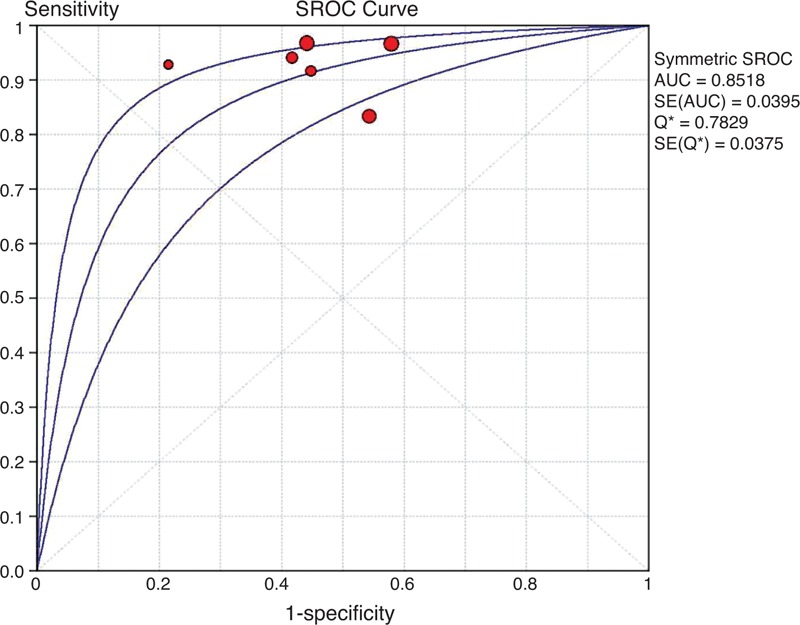
SROC curve of 11C-PIB-PET for predicting conversion to AD in patients with MCI in the short-term follow-up subgroup. A weighted symmetric SROC curve with the 95% CI was computed with the Moses-Shapiro-Littenberg method, and the quantitative value of the AUC ± SE was 0.8518 ± 0.0395. We calculated the maximum joint sensitivity and specificity as point Q∗ on a symmetric ROC curve (0.7829 ± 0.0375), which is a global measure of test accuracy. Summary ROC plots display the results of individual studies in ROC space; each study is plotted as a single sensitivity–specificity circular point. The size of points in the plot is proportional to their sample sizes. 11C-PIB-PET = 11C-Pittsburgh compound B positron emission tomography, 95% CI = 95% confidence interval, AD = Alzheimer's disease, AUC = area under curve, MCI = mild cognitive impairment, ROC = receiver-operating characteristic, SE = standard error, SROC = summary receiver-operating characteristic.