
FIGURE 4.
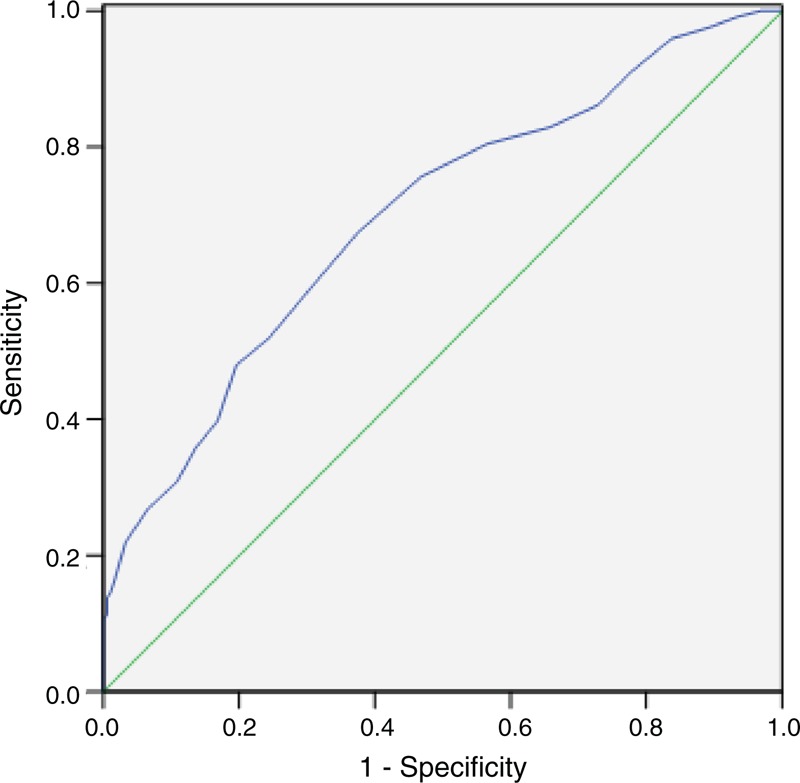
ROC curve for CSS prediction. A ROC curve plots the sensitivity on the y-axis against one minus the specificity on the x-axis. A diagonal line at 45°, known as the line of chance, would result from a test, which allocated subjects randomly. Each point on the ROC curve corresponds to a value of LC. The area under curve (AUC) was used as an estimation of diagnostic accuracy. Lymphopenia (LC < 1.0 Giga/L) predicts survival with a sensitivity of 86.2% and a specificity of 27.2%.