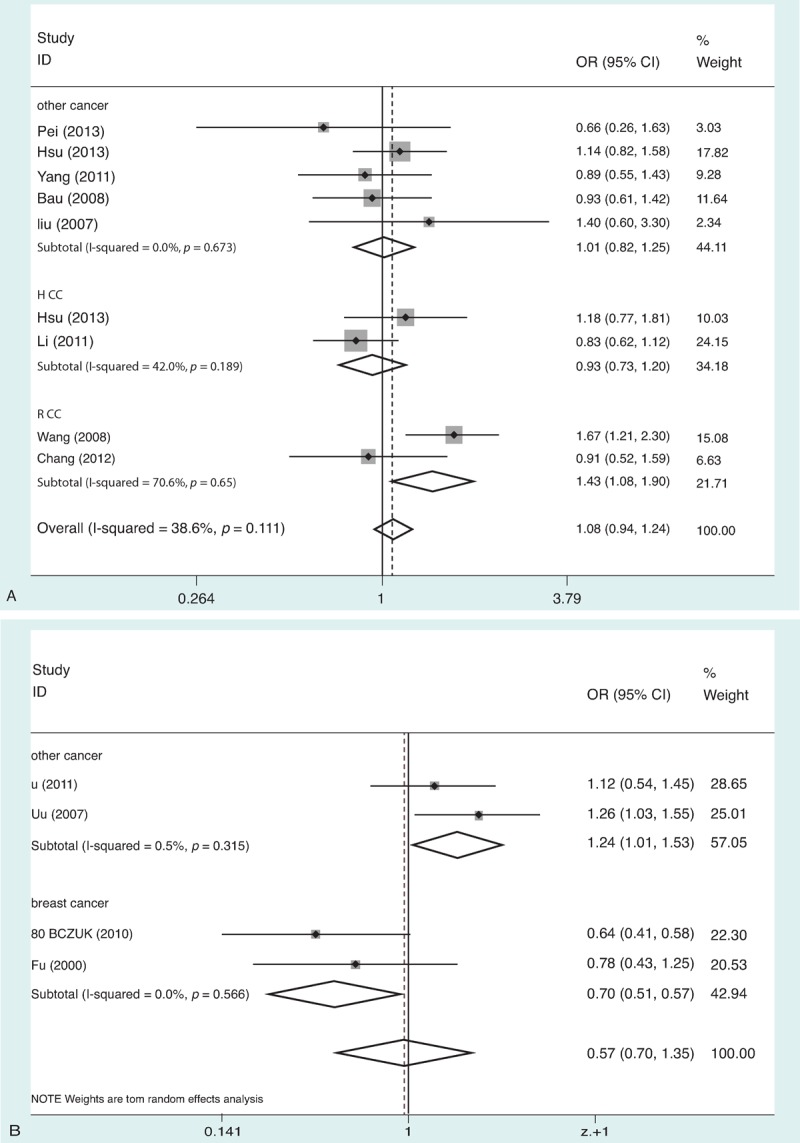
FIGURE 3.

A. Forest plot of cancer risk associated XRCC6 rs132770 polymorphism in subgroup analysis of cancer type in recessive model. B. Forest plot of cancer risk associated with the A genotypes compared with the G genotype in XRCC6 rs132793 polymorphism in subgroup analysis of cancer type.
