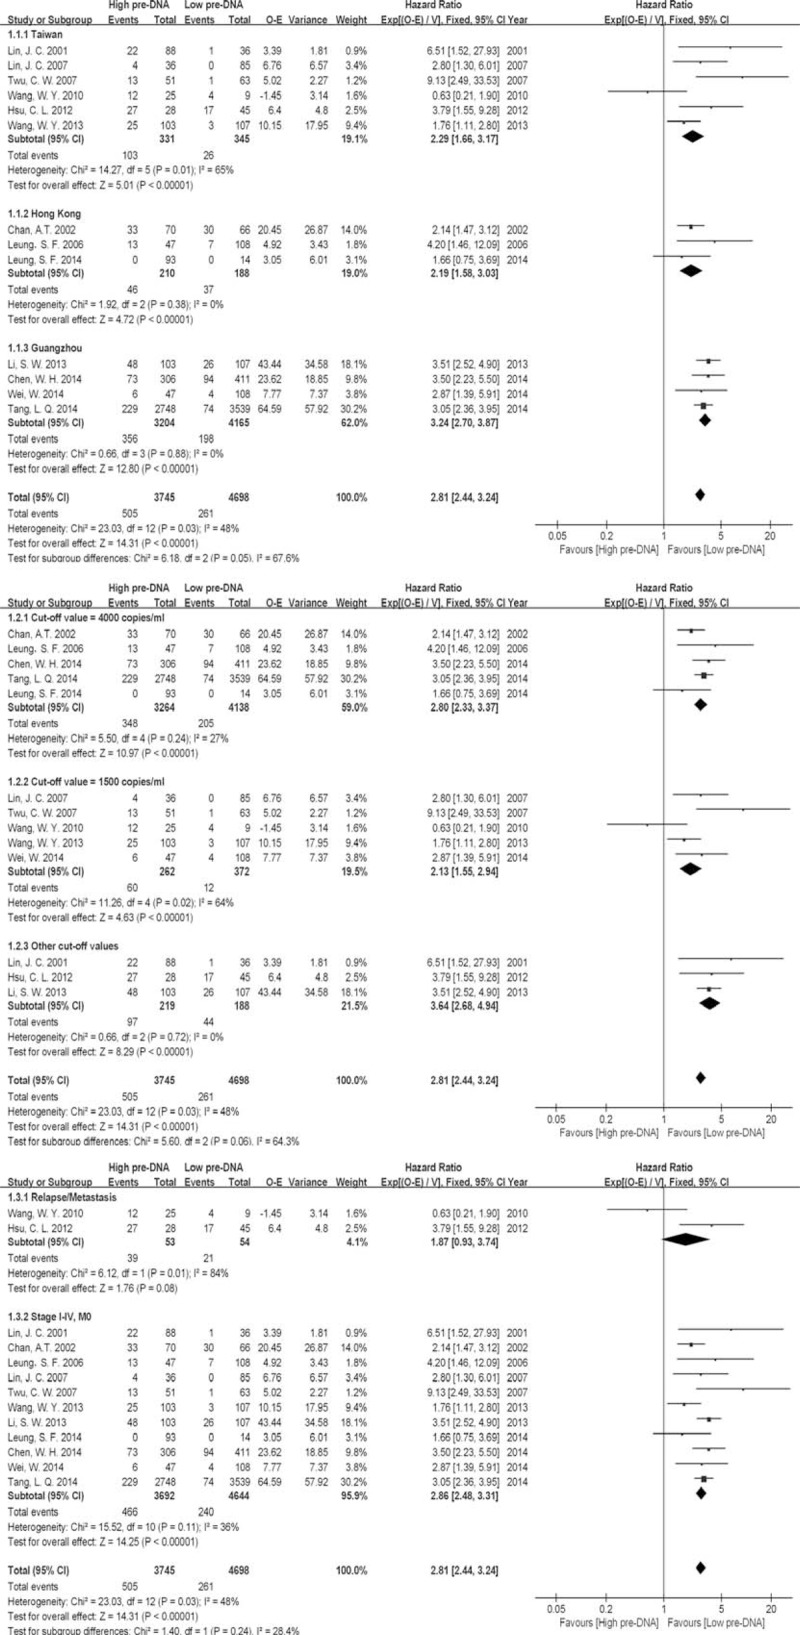
FIGURE 2.

Subgroup analysis of pre-DNA associated overall survival (OS), subdivided by population, cut-off value and inclusion stage. Note: Events for Leung, 2014 were unavailable.

Subgroup analysis of pre-DNA associated overall survival (OS), subdivided by population, cut-off value and inclusion stage. Note: Events for Leung, 2014 were unavailable.