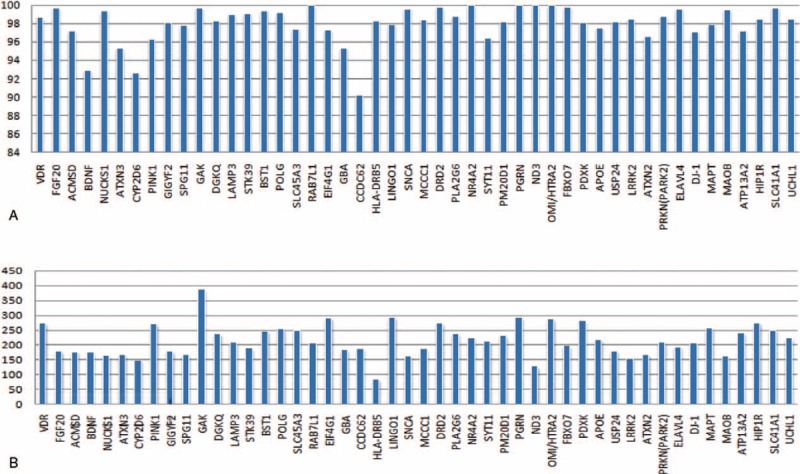
FIGURE 1.

The coverage ratio and average depth distribution in target genes. (A) The coverage ratio distribution of target genes. The coverage ratio of each gene was more than 94%, except for CCDC62 (90.23%), CYP2D6 (92.61%), and BDNF (92.96%). (B) The average depth distribution of target genes. The average depth of each target gene was over 100-fold, except for HLA-DRB5 (83.09×).
