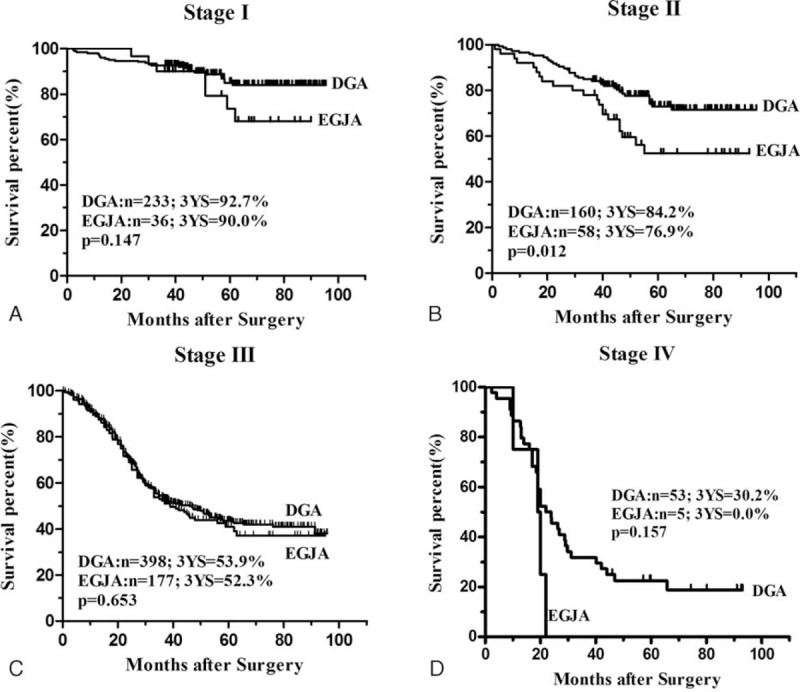
FIGURE 3.

Survival curves of gastric adenocarcinoma after R0 resection in each stage based on the tumor stages: A, Patients with stage I tumors (n = 269). There was no significant difference on survival outcomes at this stage (P = 0.147). B, Patients with stage II tumors (n = 218). There was significant difference on survival outcomes at this stage (P = 0.012). C, Patients with stage III tumors (n = 575). There was no significant different on survival outcomes at this stage (P = 0.563). D, Patients with stage IV tumors (n = 58). There was no significant different on survival outcomes at this stage (P = 0.157).
