FIGURE 3.

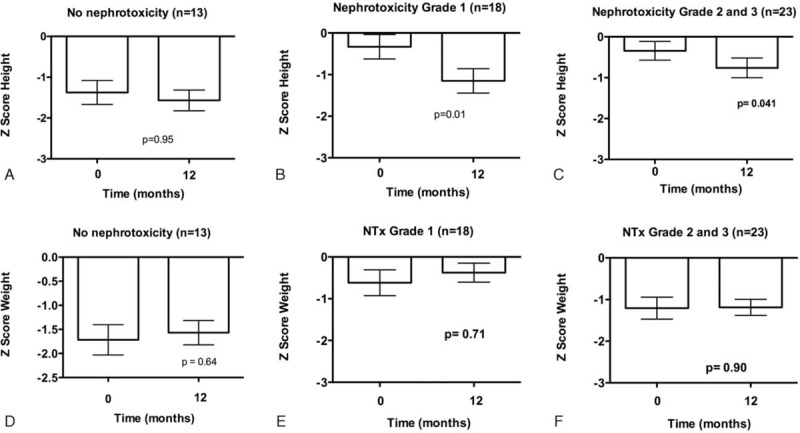
Nephrotoxicity grading and mean ± SE of height Z Score (A, B, C) and weight (D, E, F) at baseline and after 12 months of cisplatin treatment. P value obtained by paired t-test.

Nephrotoxicity grading and mean ± SE of height Z Score (A, B, C) and weight (D, E, F) at baseline and after 12 months of cisplatin treatment. P value obtained by paired t-test.