
FIGURE 2.
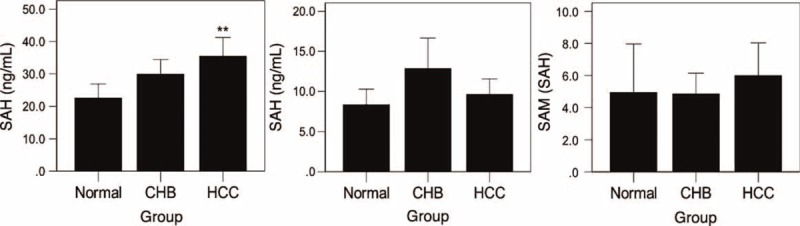
The various SAMe, SAH and SAMe/SAH levels in different groups. (A) Various SAMe levels in normal, CHB and HCC cases. There was a higher SAMe concentration in the HCC group compared with the normal group (P = 0.002) and the CHB group (P = 0.002), while no significant difference was observed between the CHB group and the normal group (P = 0.130); (B) The various SAH levels in normal, CHB and HCC cases. No significant differences were observed among the 3 groups (P > 0.05). (C) The various SAMe/SAH ratios in normal, CHB and HCC cases were similar (P > 0.05).