FIGURE 1.

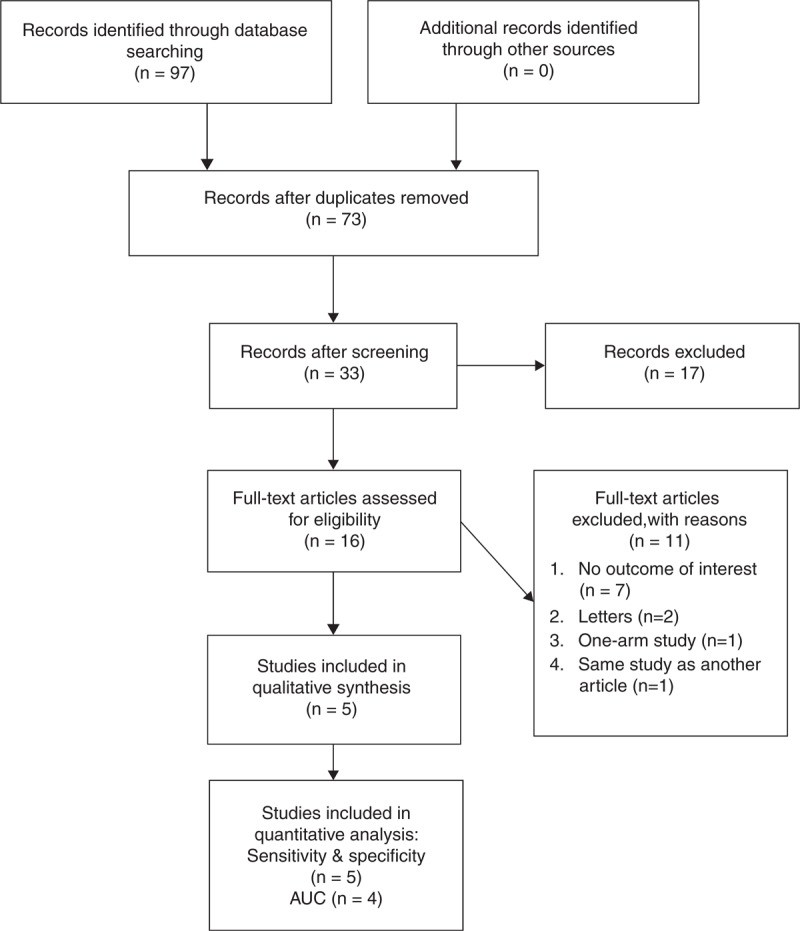
Flow diagram of study selection. AUC = area under the receiver-operating characteristic curve (adapted from PRISMA 2009 Flow Diagram template).

Flow diagram of study selection. AUC = area under the receiver-operating characteristic curve (adapted from PRISMA 2009 Flow Diagram template).