FIGURE 2.

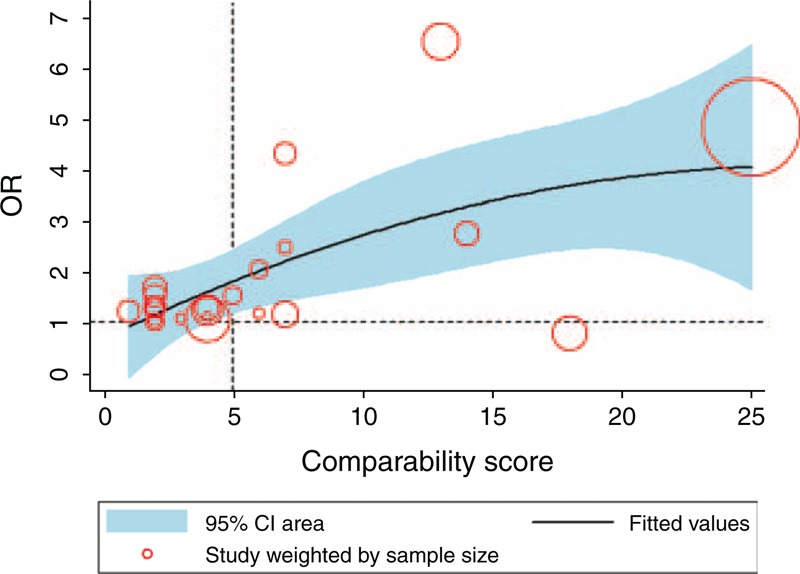
Scatter plot of the comparability scores and the ORs of the overall survival with quadratic fit and 95% CI area. CI = confidence interval.

Scatter plot of the comparability scores and the ORs of the overall survival with quadratic fit and 95% CI area. CI = confidence interval.