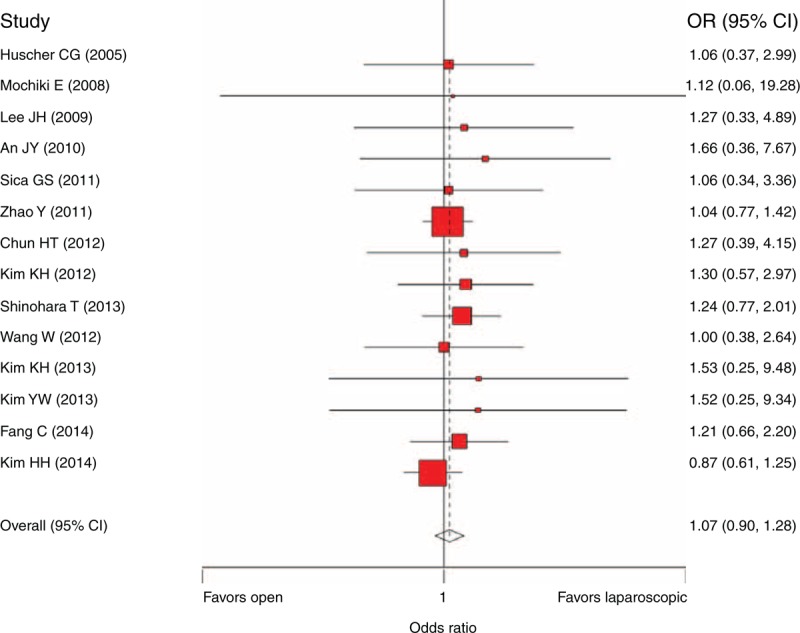
FIGURE 3.

Sensitivity analysis of the 5-year overall survival comparison (including the score ≤5 studies and the matched sub-study extracted from Kim et al, 2014).43 CI = confidence interval, OR = odds ratio.

Sensitivity analysis of the 5-year overall survival comparison (including the score ≤5 studies and the matched sub-study extracted from Kim et al, 2014).43 CI = confidence interval, OR = odds ratio.