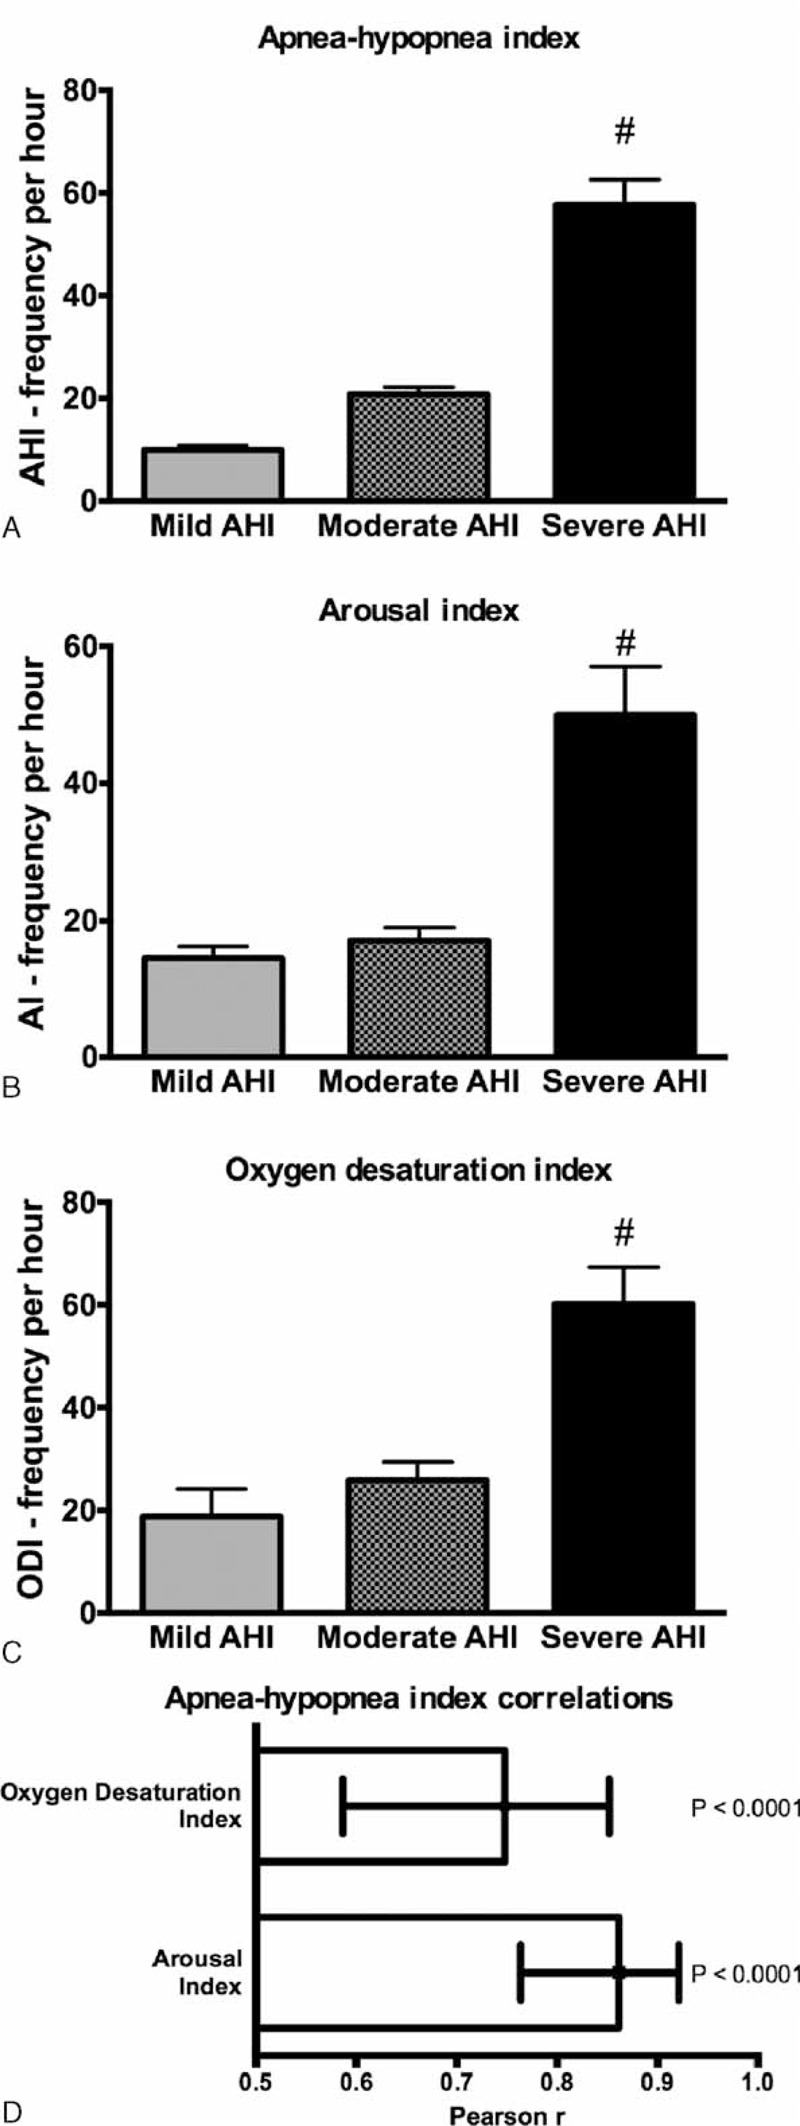
FIGURE 1.

(A) AHI, (B) AI, and (C) ODI in obstructive sleep apnea across different degrees of severity according to the AHI: mild (AHI < 15), moderate (15 < AHI < 30), and severe (AHI > 30); #, P < 0.001. (D) Correlations between AHI and the other polysomnography indexes, AI, and ODI. Values are Pearson r and 95% CI. AHI = apnea–hypopnea index, AI = arousal index, CI = confidence interval, ODI = oxygen desaturation index.
