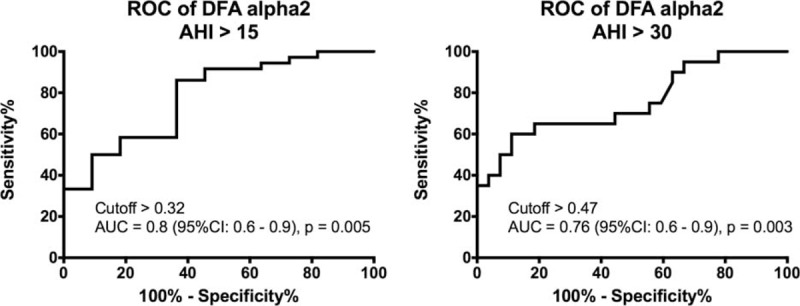
FIGURE 4.

Diagnostic yield for DFA α2 index cutoff values compared with AHI cutoff values (reference values) obtained by polysomnography. ROC curve for identifying patients with (A) moderate (AHI threshold = 15) or (B) severe obstructive sleep apnea (AHI threshold = 30). AHI = apnea–hypopnea index, AUC = area under the curve, CI = confidence interval, DFA = detrended fluctuation analysis, ROC = receiver–operator characteristic.
