FIGURE 2.

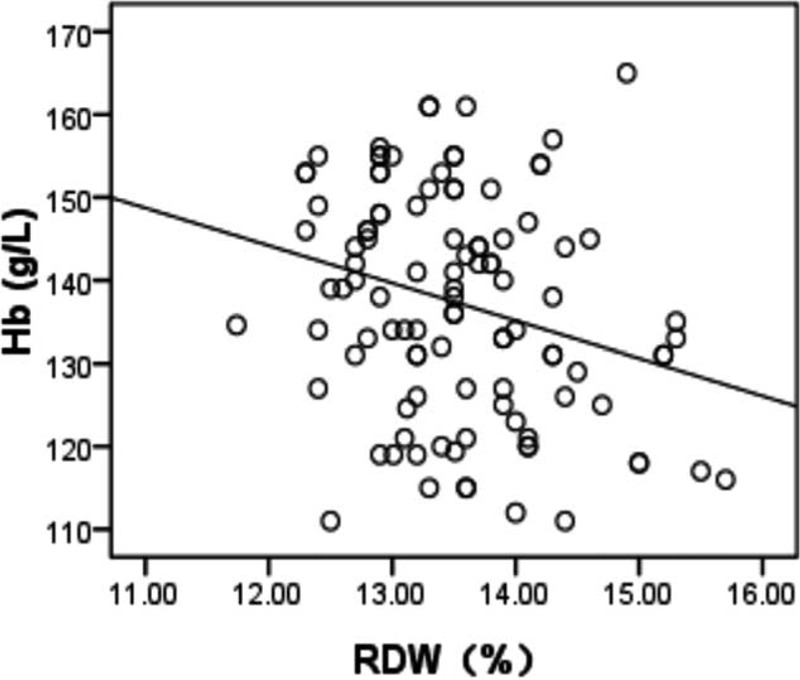
Scatter plot indicating a correlation between RDW and Hb (r = −0.386, P < 0.001) in patients with MS. Hb = hemoglobin, MS = multiple sclerosis, RDW = red cell distribution width.

Scatter plot indicating a correlation between RDW and Hb (r = −0.386, P < 0.001) in patients with MS. Hb = hemoglobin, MS = multiple sclerosis, RDW = red cell distribution width.