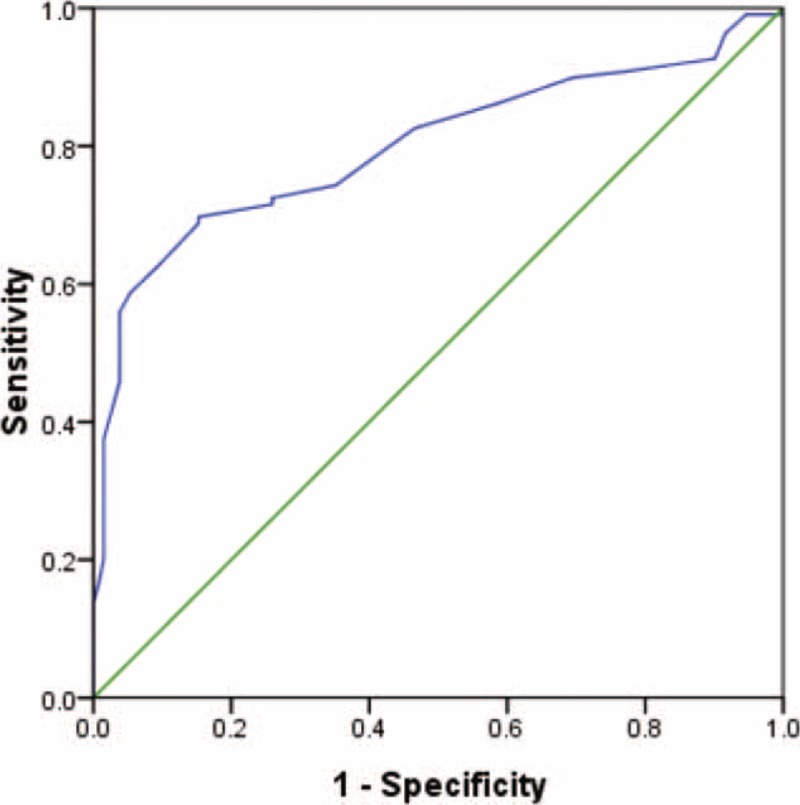
FIGURE 3.

The ROC curve analysis of RDW to estimate patients with MS. RDW measurement >13.11% evaluated MS with a sensitivity of 70.0% and a specificity of 84.7%, and the area under the ROC curve for RDW was calculated as 0.80 (95% CI 0.739–0.859, P < 0.001). MS = multiple sclerosis, RDW = red cell distribution width, ROC = receiver-operating characteristics.
