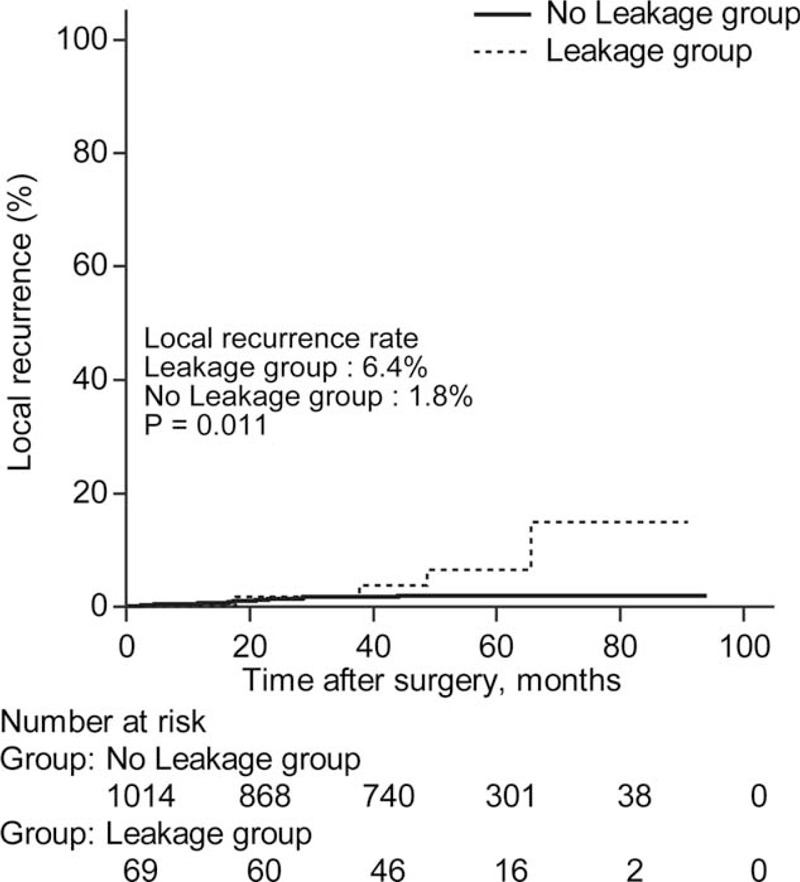
FIGURE 2.

Cumulative 5-year local recurrence rate between the leakage group and the no leakage group. Cumulative 5-year local recurrence rate was significantly higher in the leakage group than the no leakage group (the leakage group vs the no leakage group; 6.4% vs 1.8%, P = 0.011).
