
FIGURE 5.
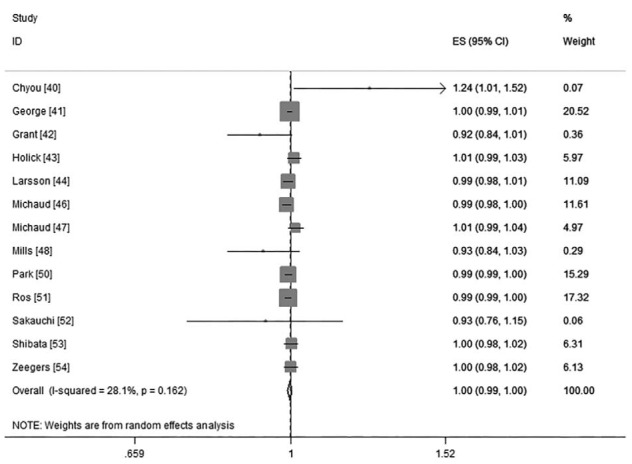
The forest plot of linear trend between total vegetables intake and risk of bladder cancer, with the dose scale was every 0.2 serving increment.
Official websites use .gov
A
.gov website belongs to an official
government organization in the United States.
Secure .gov websites use HTTPS
A lock (
) or https:// means you've safely
connected to the .gov website. Share sensitive
information only on official, secure websites.
The forest plot of linear trend between total vegetables intake and risk of bladder cancer, with the dose scale was every 0.2 serving increment.