
FIGURE 7.
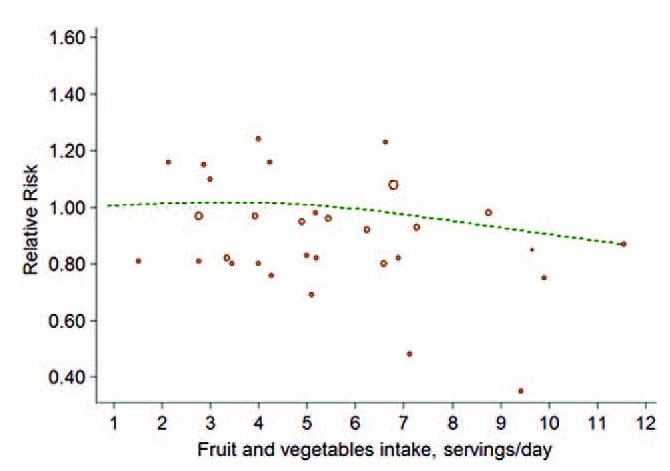
The forest plot of nonlinear association between both FVs intake and risk of bladder cancer. The hollow circles represent the relative ratios in each study weighted with inverse variance, and the green dash line is the nonlinear trend fitted by restricted cubic splines function.