
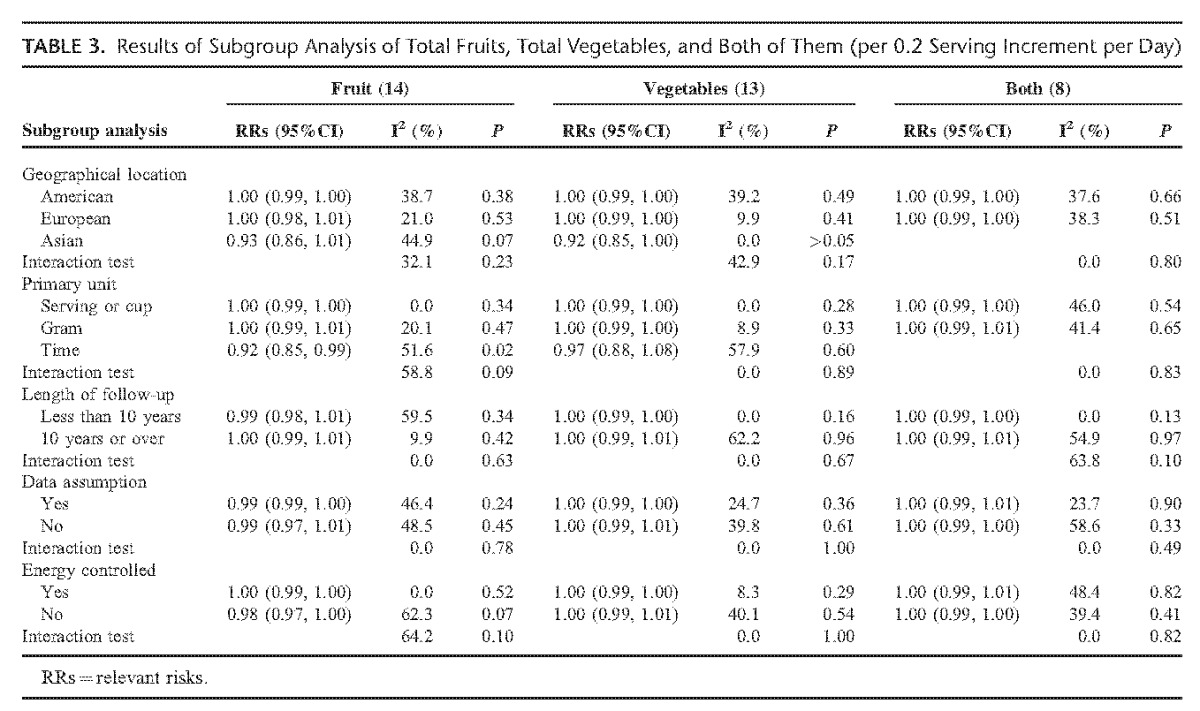
TABLE 3.
Results of Subgroup Analysis of Total Fruits, Total Vegetables, and Both of Them (per 0.2 Serving Increment per Day)
Official websites use .gov
A
.gov website belongs to an official
government organization in the United States.
Secure .gov websites use HTTPS
A lock (
) or https:// means you've safely
connected to the .gov website. Share sensitive
information only on official, secure websites.
Results of Subgroup Analysis of Total Fruits, Total Vegetables, and Both of Them (per 0.2 Serving Increment per Day)