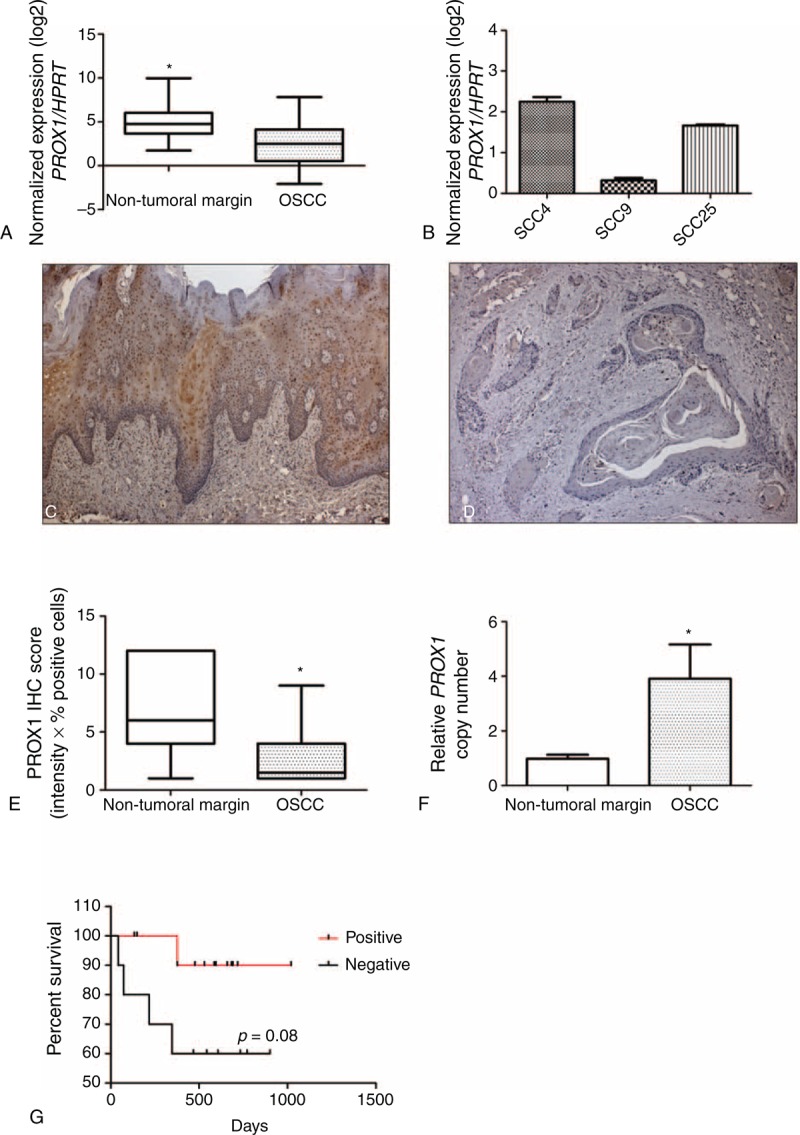
FIGURE 1.

PROX1 expression is downregulated in OSCC samples. Normalized expression of PROX1 transcripts in nontumor margins and OSCC samples (A) and in OSCC cell lines (B). The full line corresponds to the median value for each group. Asterisk indicates statistically significant difference between OSCC and nontumor samples (P < 0.001, Wilcoxon) (A). SCC9 showed reduced PROX1 mRNA expression levels (B). Immunohistochemical detection of PROX-1 in nontumoral margins (C) and OSCC (D). PROX-1 expression was found in the nucleus and cytoplasm of the epithelial cells located in suprabasal layers for the nontumor margin samples. The PROX-1 protein expression was significantly lower in OSCC samples than nontumoral margins (P < .001, Mann–Whitney U test). The IHC scores for nontumoral margins and OSCC range from 1.00 to 12.00 (median, 6.0) and from 1.00 to 9.00 (median, 1.50), respectively (E). Kaplan–Maier estimation of overall survival of OSCC patients according to PROX1 amplification (P value according to log-rank test) (F). IHC = immunohistochemistry, OSCC = oral squamous cell carcinoma, PROX1 = prospero homeobox 1.
