FIGURE 2.

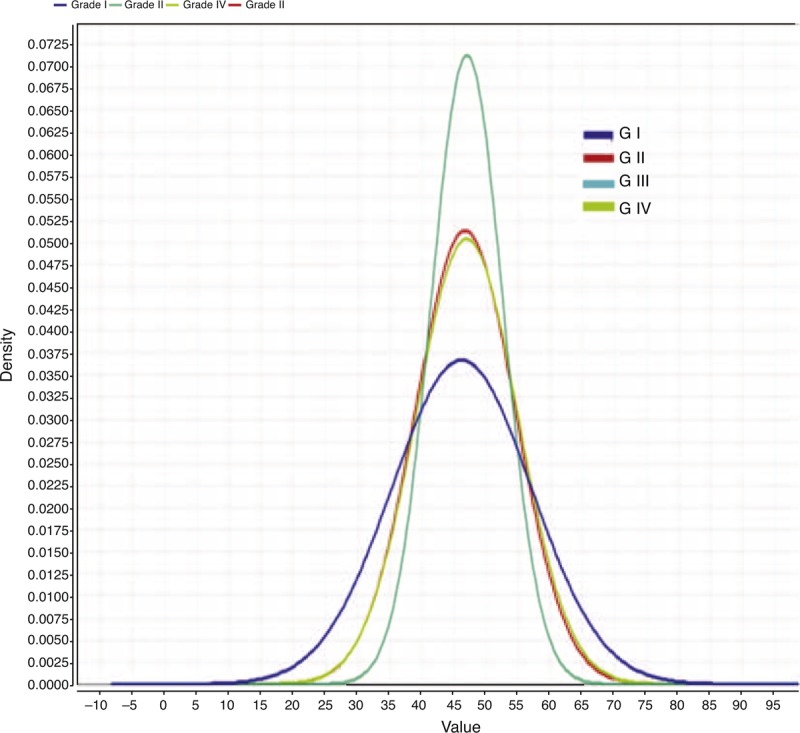
Age group according to different variceal degrees. Middle of the 4th decade is the peak of varices development. X axis represents the patient age while Y axis represents the density of each time point.

Age group according to different variceal degrees. Middle of the 4th decade is the peak of varices development. X axis represents the patient age while Y axis represents the density of each time point.