FIGURE 2.

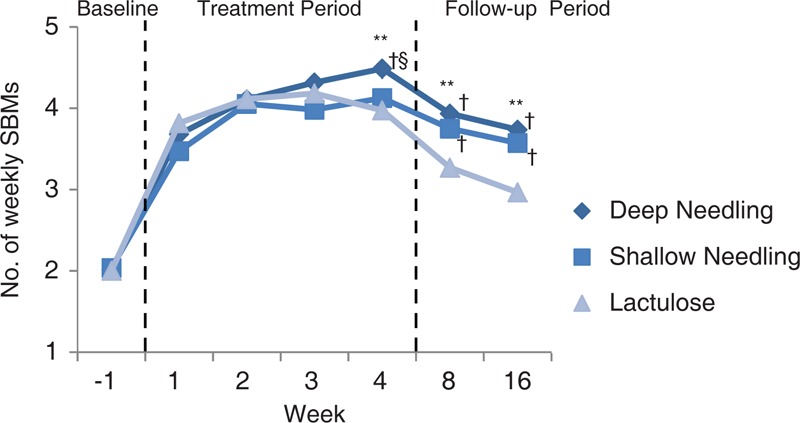
Number of SBMs/week at each assessing week. SBMs = spontaneous bowel movements. ∗∗P < 0.01 for the comparison among the 3 groups. †P < 0.05 compared with lactulose group. §P < 0.05 compared with shallow needling group.

Number of SBMs/week at each assessing week. SBMs = spontaneous bowel movements. ∗∗P < 0.01 for the comparison among the 3 groups. †P < 0.05 compared with lactulose group. §P < 0.05 compared with shallow needling group.