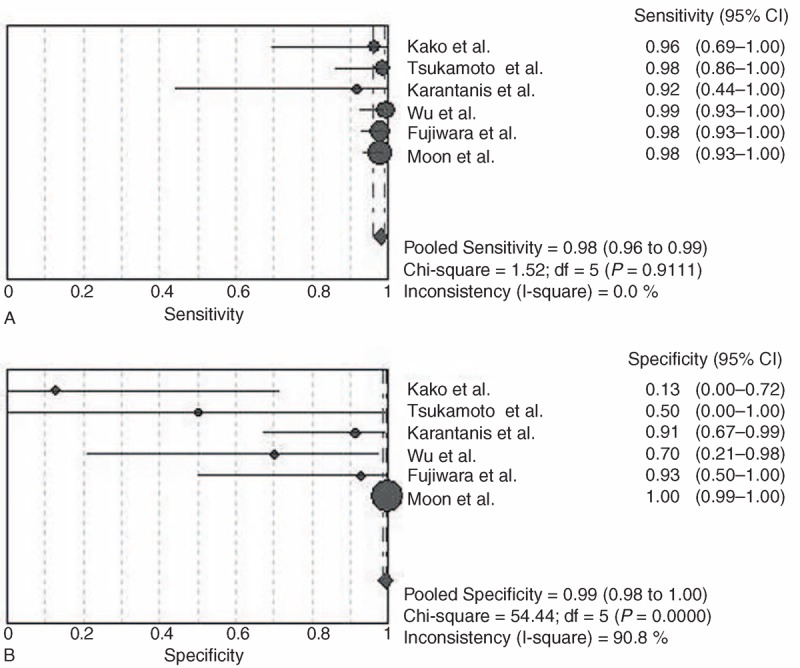
FIGURE 3.

(A) Sensitivity and 95% confidence intervals for studies assessing the diagnostic accuracy of FDG PET with lesion based data. (B) Specificity and 95% CI for studies assessing the diagnostic value of PDG PET with lesion based data. ∗The diamond represents the 95% CI of the pooled estimate.
