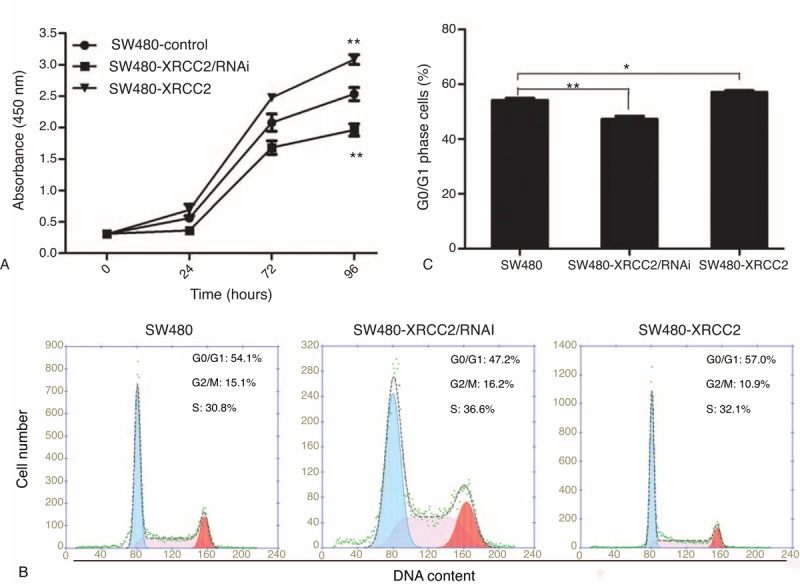
FIGURE 3.

Cell proliferation and cell cycle analyses. (A) CCK-8 assay showing that viability was highest in the SW480-XRCC2 cell line and lowest in the SW480-XRCC2/RNAi cell line in the absence of olaparib. (B) Flow cytometry analysis of DNA content. The SW480-XRCC2 cell line had the most G0/G1 cells. (C) Histogram of the percentages of G0/G1 cells. ∗P < 0.05, ∗∗P < 0.01 (Student's t test).
