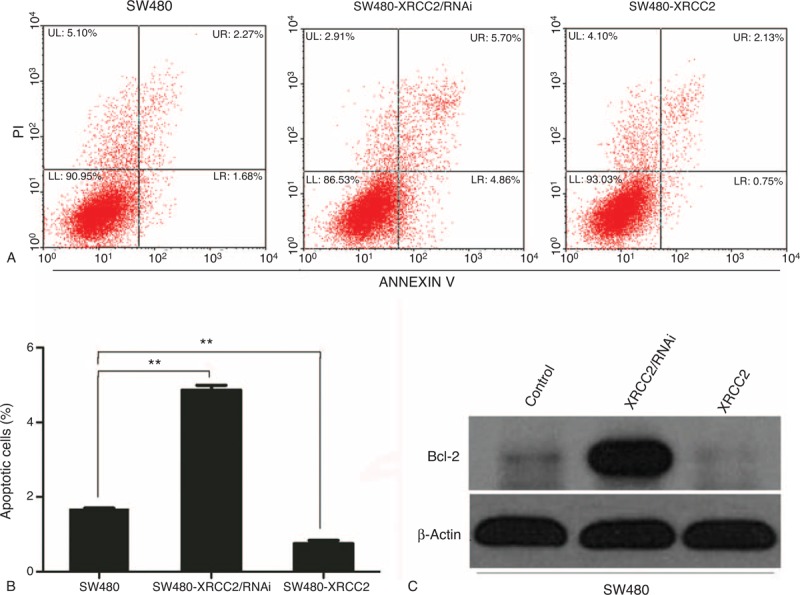
FIGURE 4.

Analysis of apoptosis. (A) The number of apoptotic cells was highest in the SW480-XRCC2/RNAi cell line. (B) Histogram of apoptotic cells in the examined cell lines. (C) Western blotting results showing that XRCC2 downregulation increased bcl-2 expression compared with the controls. ∗∗P < 0.01 (Student's t test).
