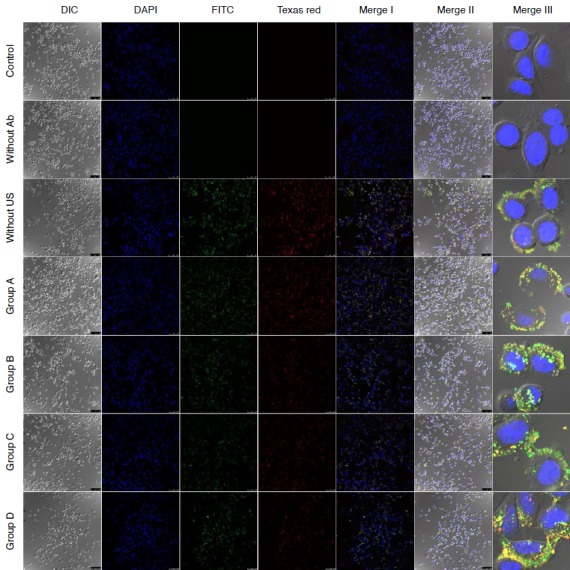
Fig. 3. Comparison of confocal laser scanning microscope images of SkBr3 treated by MB-FITC-nanoliposome-Texas red-Her2Ab complex (MLC-Her2Ab) in groups.

Merge I images are combined images of DAPI, FITC, and Texas red mode. Merge II images are combined images of differential interference contrast (DIC) and Merge I mode. Merge III images are magnified images of Merge II. The group without Her2Ab shows no fluorescence intensity. This is similar to the control group. The group without ultrasound (US) shows some fluorescence intensity, mainly in the region outside of SkBr3. Groups A-D showed some fluorescence intensity both outside and inside SkBr3 in a ratio depending on the US conditions of intensity, time, and duty cycle: group A, 1 w/cm2, 1 minute, 20% duty cycle; group B, 1 w/cm2, 1 minute, 60% duty cycle; group C, 1 w/cm2, 2 minutes, 20% duty cycle; group D, 2 w/cm2, 1 minutes, 20% duty cycle (DIC, DAPI, FITC, Texas red, Merge I, and Merge II, ×20; Merge III, ×63).
