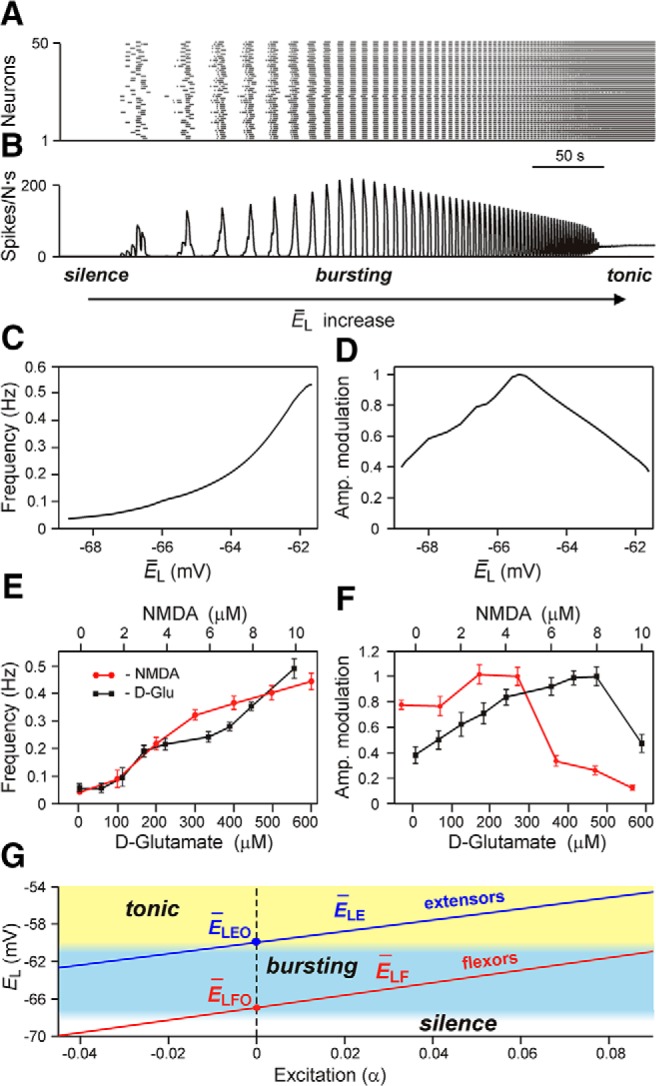
Figure 5.

Modeling of an isolated rhythm-generating population. A, Raster plot of the activity of 50 neurons from the 200-neuron population. Each horizontal line represents a neuron, and each dot represents a spike. B, Integrated population activity represented by the average histogram of population activity [spikes/(neuron × s), bin = 100 ms]. In A and B, the average leakage reversal potential (ĒL) defining the average level of neuronal excitation was linearly increased from −70 to −58 mV for 400 s. Voltage regions of silence, bursting, and tonic activity are denoted at the bottom. Bursting emerges at lower values of ĒL in a limited number of neurons. With increasing ĒL, more neurons become involved and the population bursting becomes strongly synchronized. A further increase of ĒL leads to a transition to tonic activity. C and D, respectively, show the frequency of and amplitude of population activity as functions of ĒL. E and F, respectively, show the frequency and amplitude of NMDA/5-HT-evoked locomotor activity in the isolated mouse spinal cord recorded in vitro from the flexor ventral root as a function of NMDA (red circles) or d-glutamate (black squares) concentration (the amplitude was normalized with respect to the maximal amplitude). Graphs display the mean ± SD (n = 20 each). G shows changes of ĒL for flexor (ĒLF, red line) and extensor (ĒLE, blue line) RG centers during increasing neuronal excitation with an increase in drug concentration [defined by parameter α, (ĒLi = ĒLiO · (1 − α))] across areas for silence (white), bursting (blue), and tonic (yellow) population activity. This figure is reproduced from Shevtsova et al. (2015), their Figure 2, with permission.
