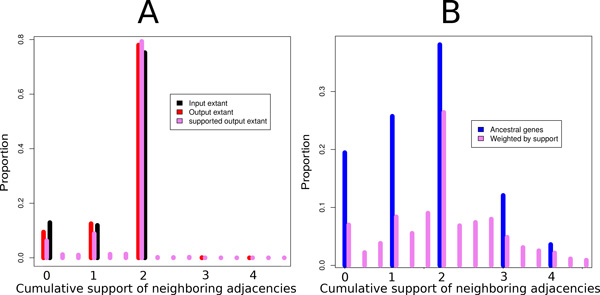
Figure 8.

Weighted neighborhoods of extant (A) and ancestral genes (B). Distribution of the proportion of extant and ancestral genes with a given neighborhood weight in extant genomes before and after adjacency prediction, with or without support, for the data set on 39 mammals. The neighborhood weight of a gene is the sum of the supports of all adjacencies involving this gene. Continuous values are binned by intervals.
