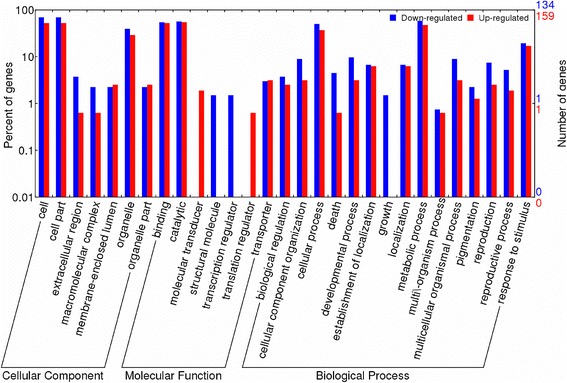
Fig. 5.

Comparison of Gene Ontology classifications of DEGs in domesticated vs. wild wheat. Blue color indicates down-regulated DEGs in domesticated compared to wild wheat, red color indicates up-regulated DEGs in domesticated compared to wild wheat. All of DEGs are categorized into 29 functional groups based on GO classification
