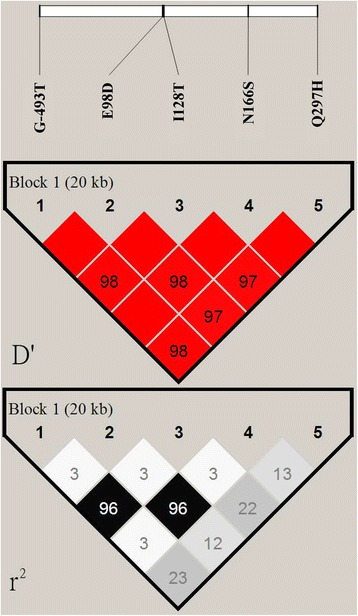
Fig. 1.

Haplotype block map for five common MTTP polymorphisms. Top plot: The linkage disequilibrium between two SNPs is standardized as D’. The dark grey cells indicate strong linkage disequilibrium among these SNPs. Bottom plot: The gray-scale spectrum (from left to right) indicates pairwise r 2 (%) values ranging from black (r 2 = 1) to white (r 2 = 0)
