
Fig. 3.
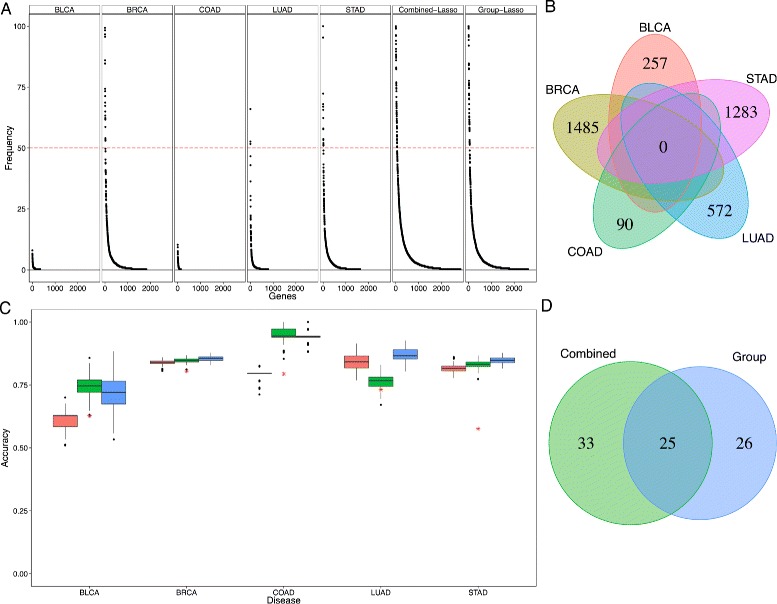
Gene expression variations predictive of CIMP. a Stability of each gene signature for each tissue-specific CIMP prediction as well as the “Combined-Lasso” and the “Group-Lasso” CIMP prediction task obtained and ranked by frequency of appearance using bootstrap (n=100 repeats). For bladder and colon CIMP prediction task, the signature was non-robust (frequency of the most redundant gene inferior to 10 %). The combined prediction task signature outperforms the tissue-specific signatures in robustness. b Venn diagram of the tissue-specific gene signatures using lasso for each tissue separately. c Distribution of the accuracy of the CIMP-phenotype prediction task given the patient gene expression profile using n=100 bootstrap and threefold cross-validation for several methods (pink = “tissue-specific” lasso, green = “Combined-Lasso,” blue = “Group-Lasso,” red star = random prediction). d Venn diagram representing the intersection between the “Combined” and “Group” lasso gene signatures