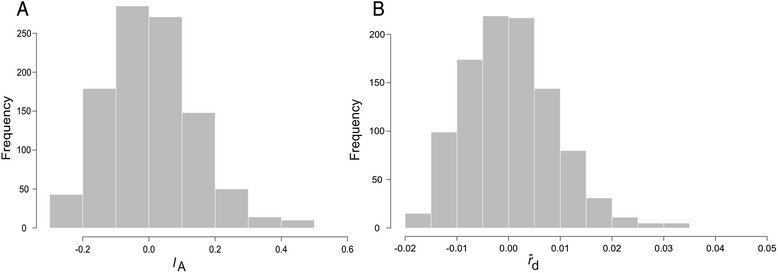
Fig. 2.

Analysis of multilocus linkage disequilibrium in L. panamensis microsatellite data. Bars represent the distribution of the statistics obtained from randomized datasets simulating free recombination. a resampling test for Index of Association (I A); b resampling test for d. The observed statistics in the original dataset were I A = 2.19, d = 0.145 (both P < 0.001)
