Fig. 3.

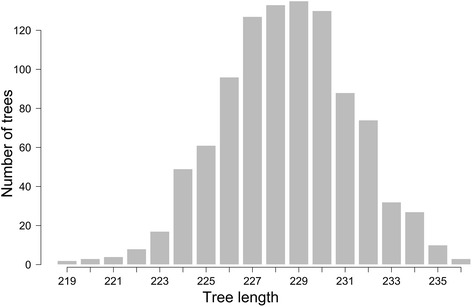
Analysis of recombination signature using parsimony tree length permutation test. Bars show the simulated distribution of tree lengths under the assumption of frequent recombination. Observed tree length = 163, P < 0.001

Analysis of recombination signature using parsimony tree length permutation test. Bars show the simulated distribution of tree lengths under the assumption of frequent recombination. Observed tree length = 163, P < 0.001