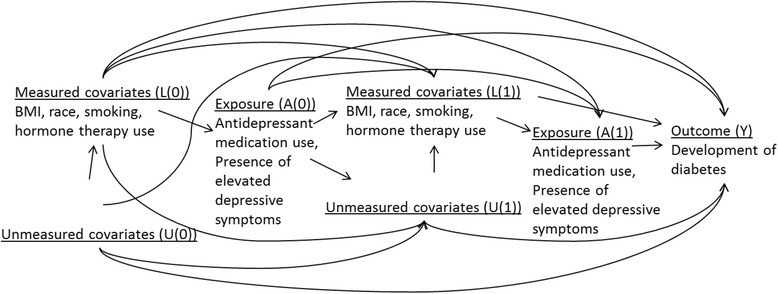
Fig. 2.

Illustration of time-dependent confounding by BMI in the association of antidepressant medication use and time to development of diabetes. Illustrates the hypothesis that there is time-varying confounding by BMI with regard to the association between diabetes risk and the presence of elevated depressive symptoms/antidepressant use. Let A denote the exposure or presence of elevated depressive symptoms/antidepressant use, L denotes measured covariates such as BMI or race, U denotes unmeasured covariates and Y denotes the outcome (diabetes). The causal graph illustrates that the probabilities of elevated depressive symptoms/antidepressant medication use (A) depends on BMI (L), but not U. There is confounding by measured covariates, but no confounding by unmeasured covariates. The probabilities of elevated depressive symptoms/antidepressant medication use at baseline (A(0)) is influenced by baseline BMI (L(0)). In our example, confounding is time dependent because exposure at time 1 (A(1)) is affected by previous exposure (A(0)) and BMI at time 1 (L(1))
