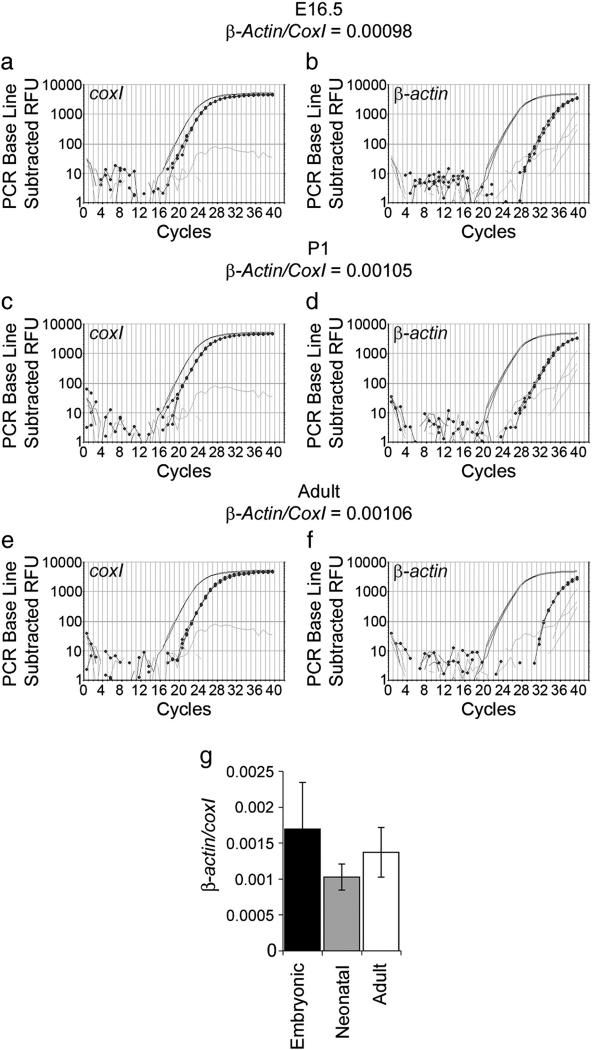
Fig. 4.
Quantification of β-actin mRNA in embryonic, neonatal and adult rat axon-only preparations. Examples of qPCR graphs for E16.5 (a, b), P1 (c, d), and adult (e, f) axon preparations. The positive control is shown in plain black, the axon-only preparation in dotted black, and the water control in grey. (g) Quantification of β-actin (b, d, f) levels relative to coxI (a, c, e) showed no significant difference between the developmental stages (ANOVA p=0.35).

