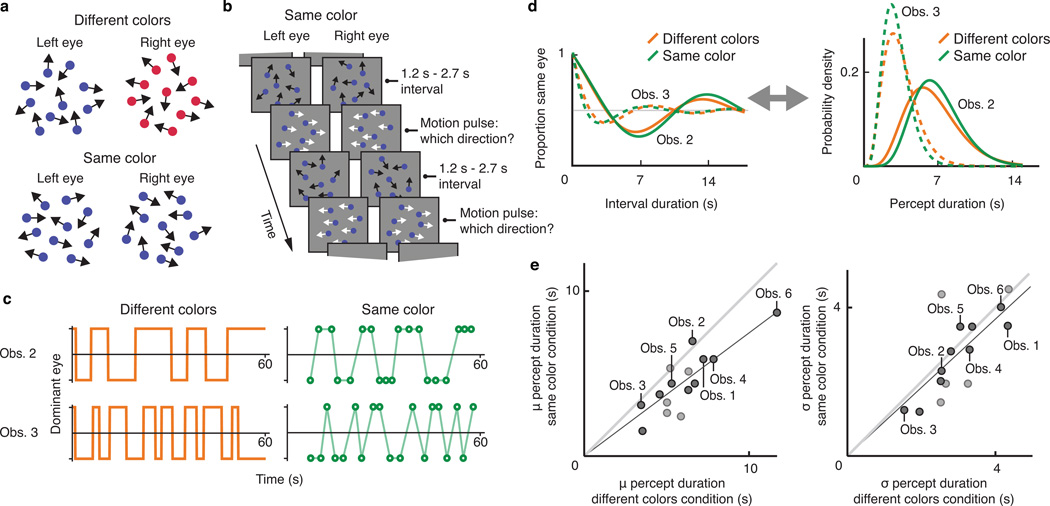
Figure 1.
Psychophysical experiment investigating stochastic properties of the perceptual sequence. a. Schematic illustration of the visual stimuli used throughout all experiments in this study. b. Trial sequence in the same color condition of the first psychophysical experiment. c. Examples of perceptual sequences as reported by two individual observers, designated Obs. 2 and Obs. 3, in the different colors condition (left, orange) and the same color condition (right green). d. Autocorrelation curves (left) and percept duration distributions (right) for the same two observers in the different colors condition (orange) and in the same color condition (green), inferred from data such as shown in c. e. Left panel: 15 individual observers' estimated mean percept duration in the different colors condition (x-axis) and in the same color condition (y-axis). Linear regression indicates a strong positive correlation: slope=.75, r2=.96, F(1,14)=313, p<1·10−6. The two different dot shades represent observers whose autocorrelation data in the same color condition are (dark dots) or are not (light dots) significantly different, on an individual-observer basis, from what would be predicted from random button presses (bootstrap analysis; dark dots: p=.004, .008 or p<.002, the latter being the bootstrap analysis' smallest measurable p value; light dots: p=.07, .14, .22, .28 and .64); see Online Methods). Right panel: same as left but depicting estimated standard deviations of the percept duration distributions. Linear regression again indicates a strong correlation: slope=.92, r2=.94, F(1,14)=284, p<1·10−6.

