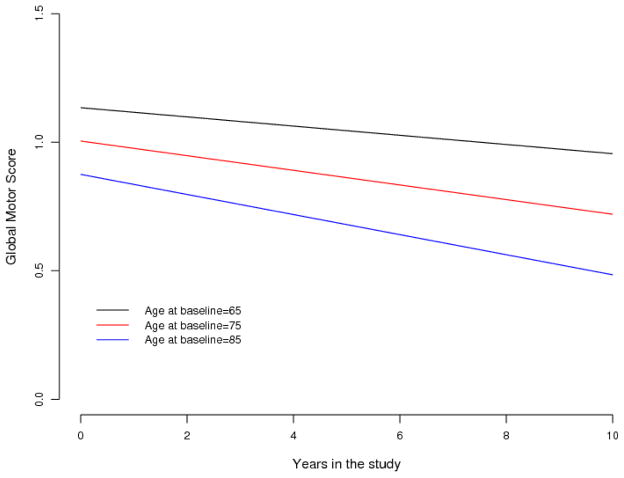
Figure 3. Annual Rate of Change in Global Motor Scores Accelerates With Increasing Age at Baseline in Older African American Adults.
This figure illustrates how the annual rate of change in global motor scores varies with baseline age by showing mean trajectories of declining global motor scores during the study for 3 groups of MARS participants, females with 15 years of education and with different ages at baseline.

