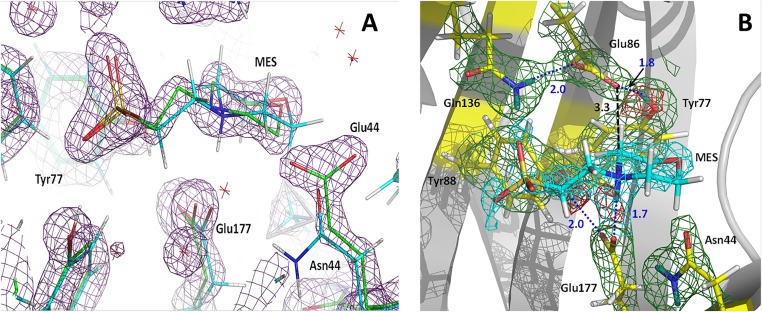
Fig. S3.
(A) Superposition of the active sites in N44E-Mes (green carbon atoms, dark magenta; 2FO − FC electron density map contoured at 2.0σ level) and WT-Mes (cyan carbon atoms). (B) Neutron scattering length density maps for the active site in WT-Mes. 2FO − FC map is shown as green mesh (cyan for the ligand) contoured at 1.5 σ. FO − FC omit map is shown as red mesh contoured at 3.0 σ. Hydrogen bonds are depicted as blue dotted lines. D atoms are dark teal whereas H atoms are light gray. Distances are in Å.

