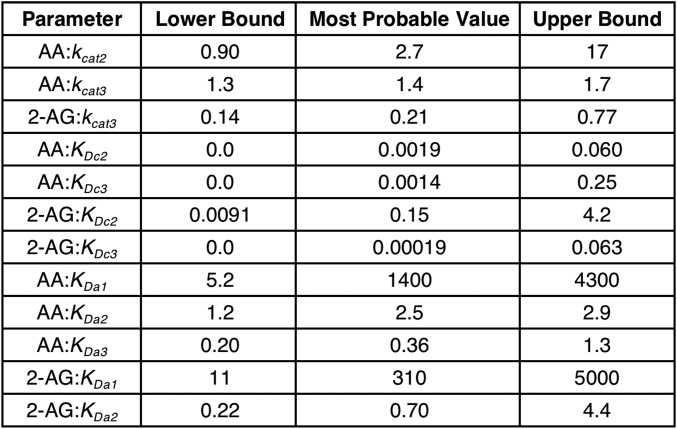
Fig. S7.
CORM 95% credible intervals and most probable parameter values obtained from sampling. These represent the minimum-width credible intervals enclosing the region of highest posterior probability density. All kcat parameter values are expressed in units of per second, and all KD parameters are in micromolar concentration.

